Forest Monitoring Dashboards brings every forest dataset for Forest Andulau, Brunei, into one browser workspace, with the CanopeAI assistant built into each view. Developed by IADA at Universiti Brunei Darussalam, the project turns scattered LiDAR scans, drone flights, satellite passes, and terrain models into a set of connected, interactive dashboards that anyone can open in a web browser, with no specialist GIS software to install.
Visit the dashboards: iada.ubd.edu.bn/forest
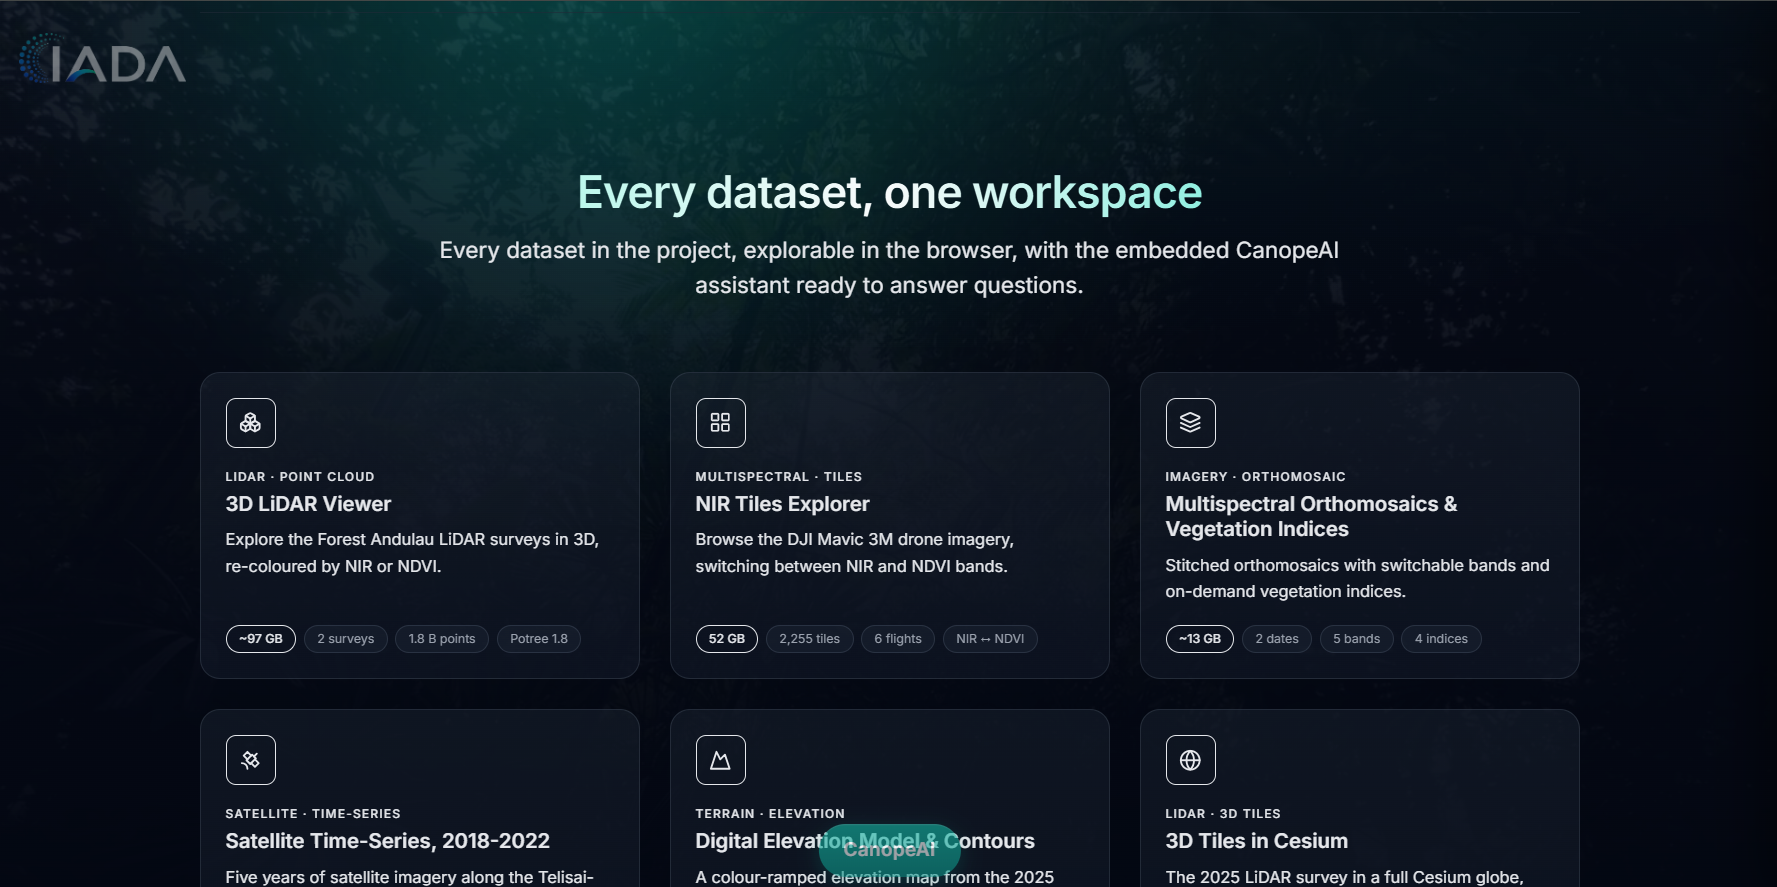
One workspace for every dataset
Forest data usually lives in separate files, formats, and tools, each needing its own software and a steep learning curve. We pulled the full picture of Forest Andulau together: 3D LiDAR point clouds, drone multispectral imagery, a satellite time-series, and terrain models, all reachable from a single workspace.
Every dashboard shares the same look, the same controls, and the same data-aware assistant, so moving between a point cloud and a satellite map feels like switching tabs rather than switching programs.
3D LiDAR
The LiDAR workspace streams roughly 1.8 billion points, about 97 GB across two surveys, straight into the browser using Potree. You can fly through the canopy, measure distances and heights, and re-colour the cloud by NIR or NDVI to read vegetation health directly off the structure of the forest.
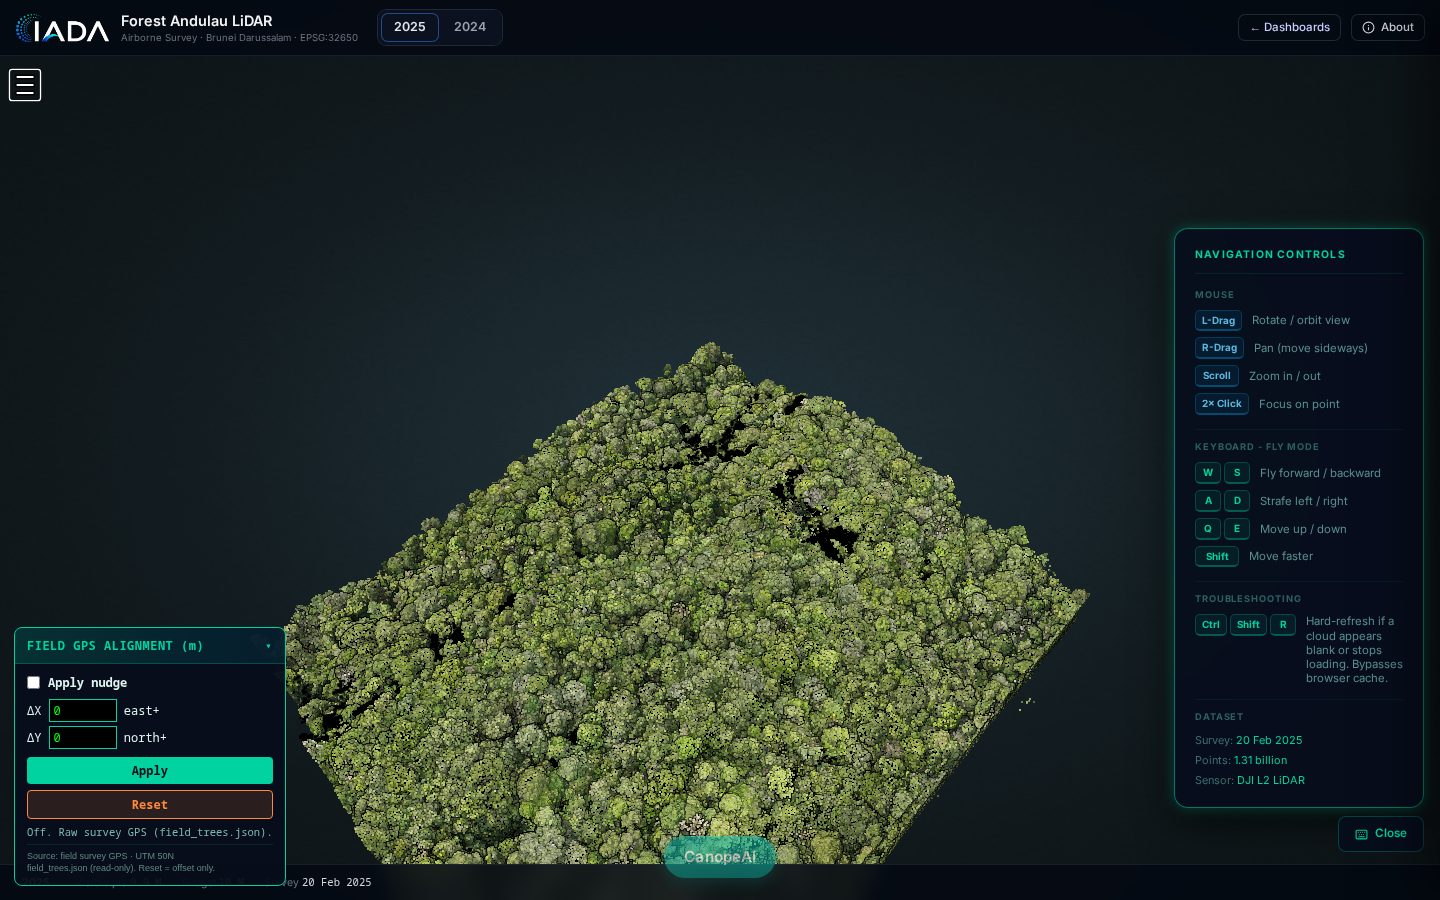
The Potree 3D viewer rendering the Forest Andulau LiDAR point cloud as a green canopy, with field GPS alignment and NIR/NDVI analysis controls.
Alongside the raw point cloud, a Cesium globe presents the 2025 survey as 3D tiles, placing the forest in its real-world geographic context for smooth, zoomable exploration from a wide landscape view down to individual trees.
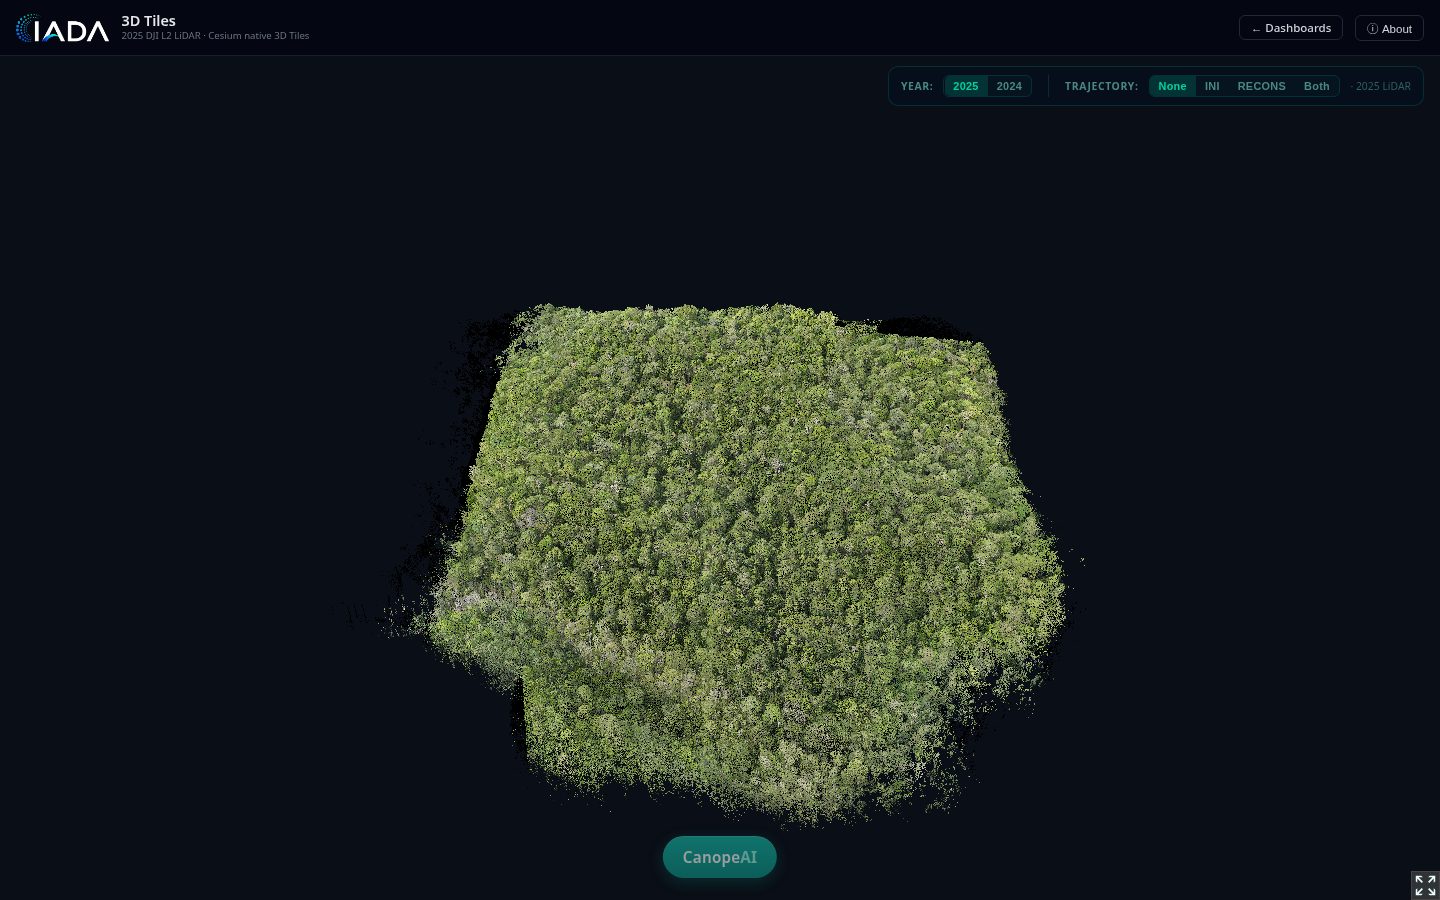
A single forest plot from the 2025 LiDAR survey rendered as a green 3D point cloud, streamed as 3D Tiles into Cesium for smooth navigation.
Drone multispectral imagery
Imagery from a DJI Mavic 3M feeds two complementary views. The NIR Tiles Explorer serves 2,255 tiles, about 52 GB captured over six flights, letting you pan and zoom across high-resolution near-infrared coverage of the survey area.
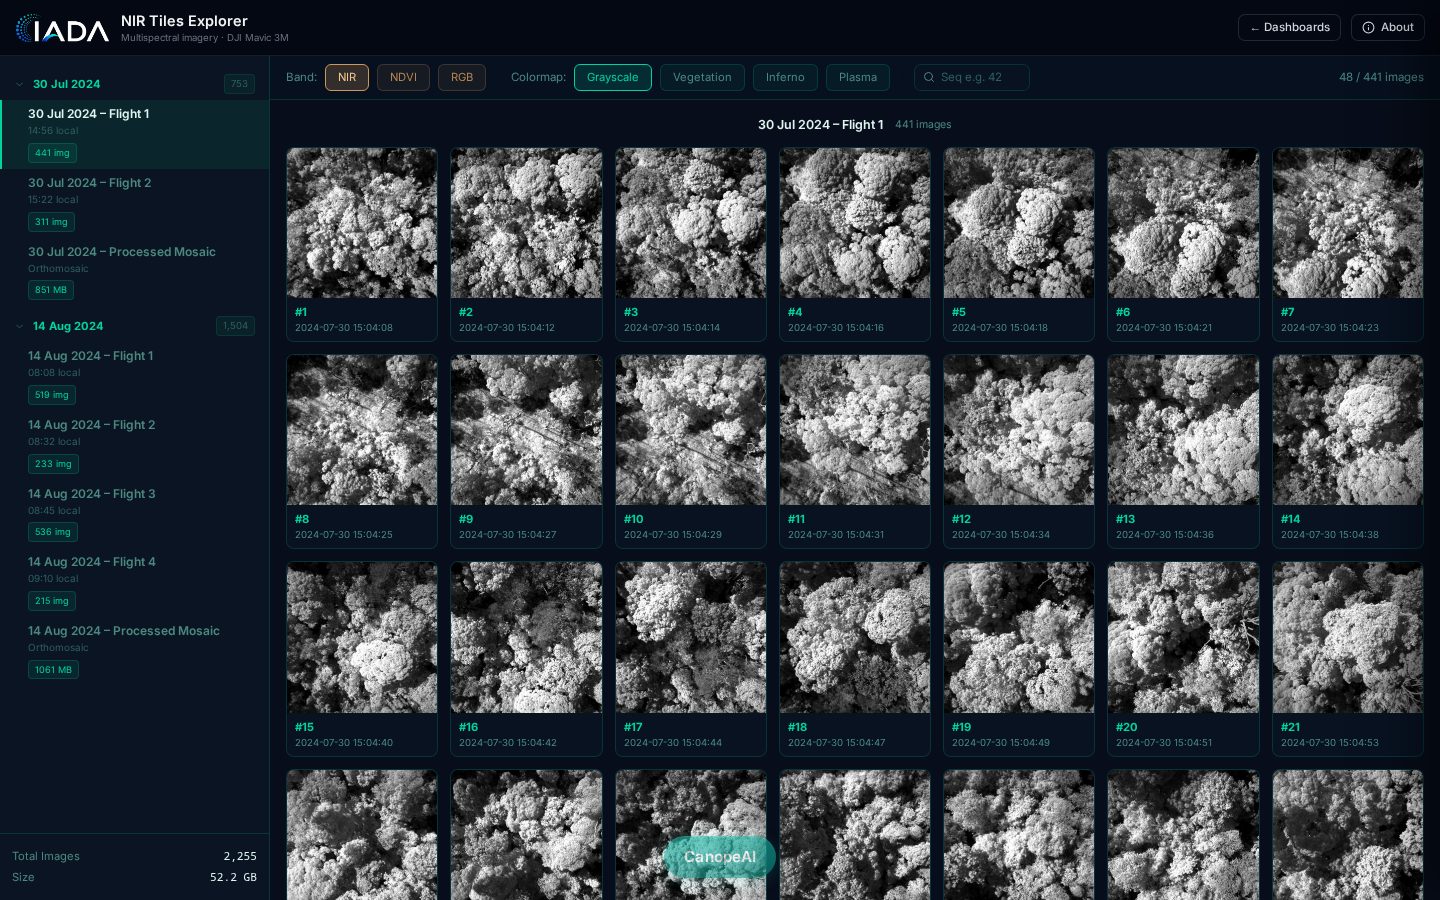
NIR Tiles Explorer in greyscale band, browsing DJI Mavic 3M canopy tiles from the 30 Jul 2024 Flight 1, with band toggles and a per-flight sidebar.
The second view presents stitched orthomosaics carrying five spectral bands and four vegetation indices, so analysts can switch between band combinations and indices to highlight stress, growth, and land-cover patterns across the whole site.
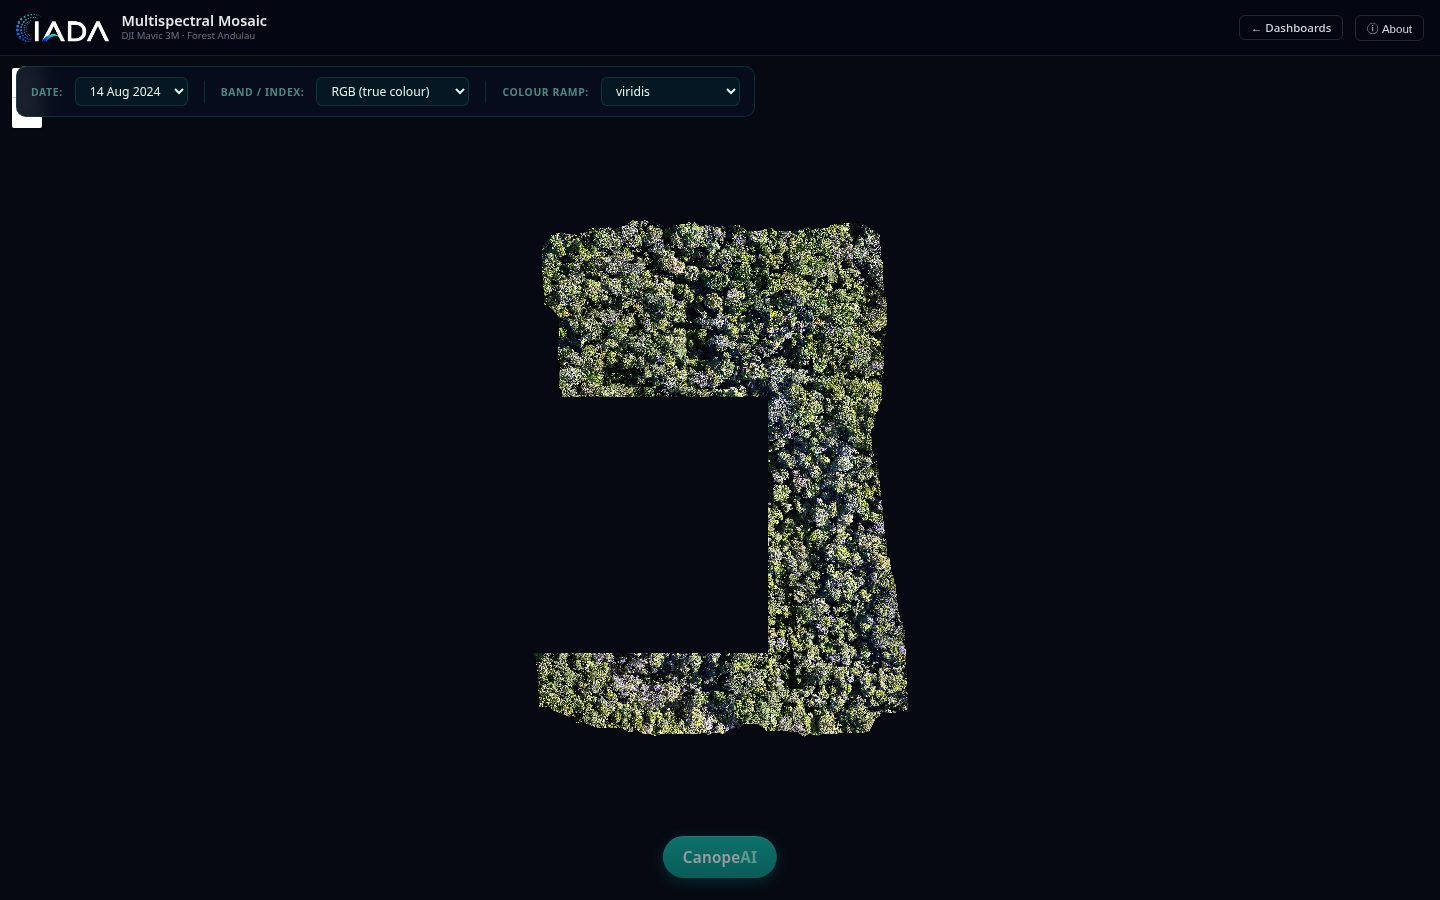
A true-colour RGB drone orthomosaic of forest canopy, with selectors for date (14 Aug 2024), band or vegetation index, and colour ramp.
Satellite time-series
For the longer view, a satellite time-series covers the Telisai-Lumut corridor from 2018 to 2022 across 14 dates, each paired with land-cover masks. Stepping through the dates reveals how the corridor has changed over five years, from seasonal shifts to longer-term land-cover transitions.
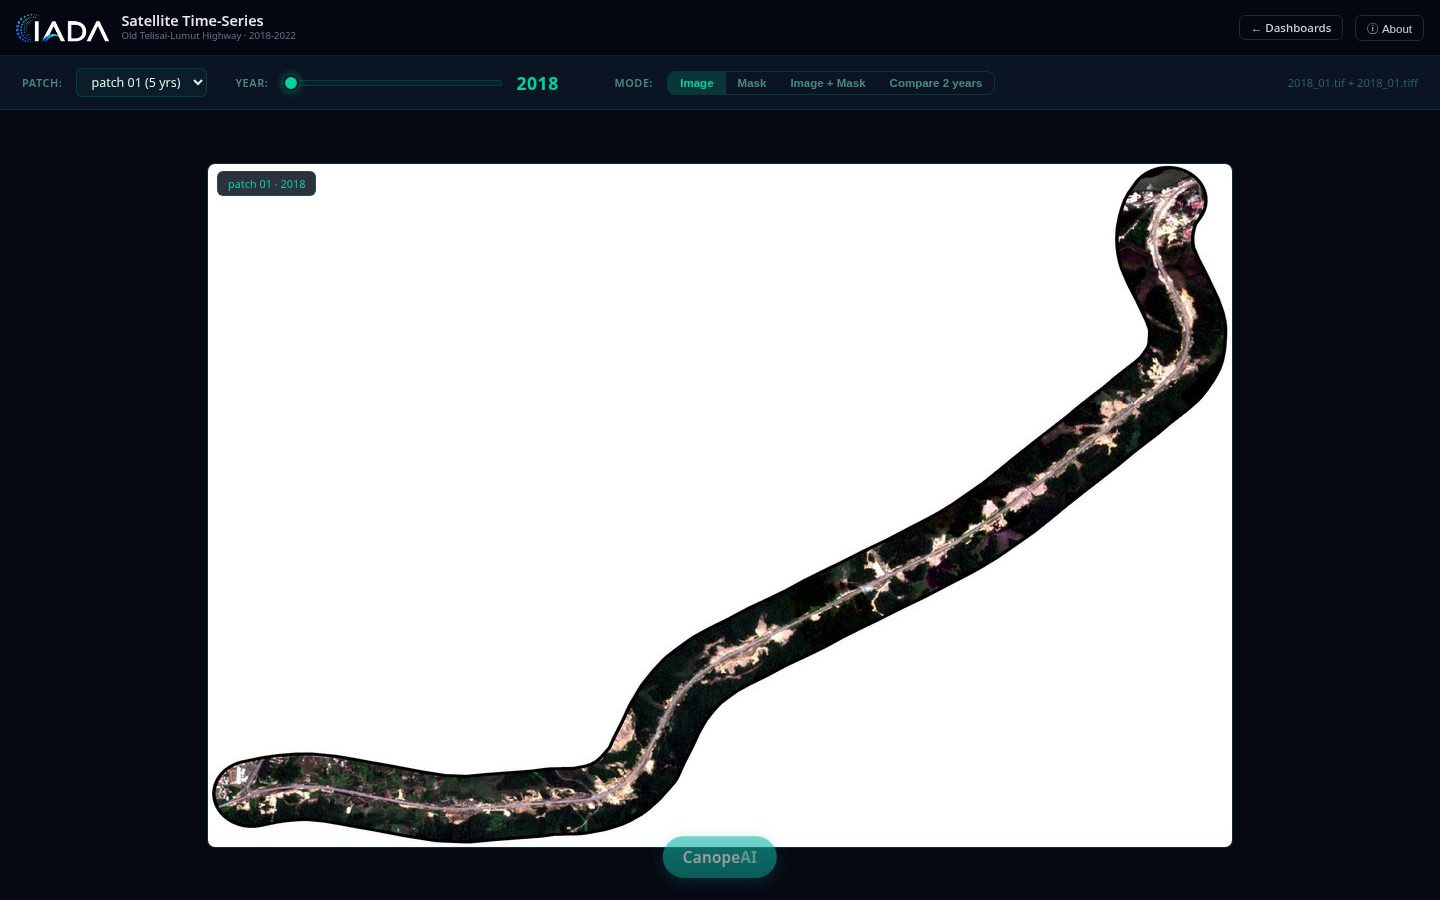
IADA Satellite Time-Series dashboard in Image mode showing 2018 imagery of patch 01 along the Telisai-Lumut corridor, with a year slider and image, mask, and compare modes.
Terrain
A digital elevation model derived from the 2025 LiDAR, complete with contour lines, captures the shape of the land beneath the canopy. It underpins the other dashboards and supports terrain-aware reading of slope, drainage, and elevation across Forest Andulau.
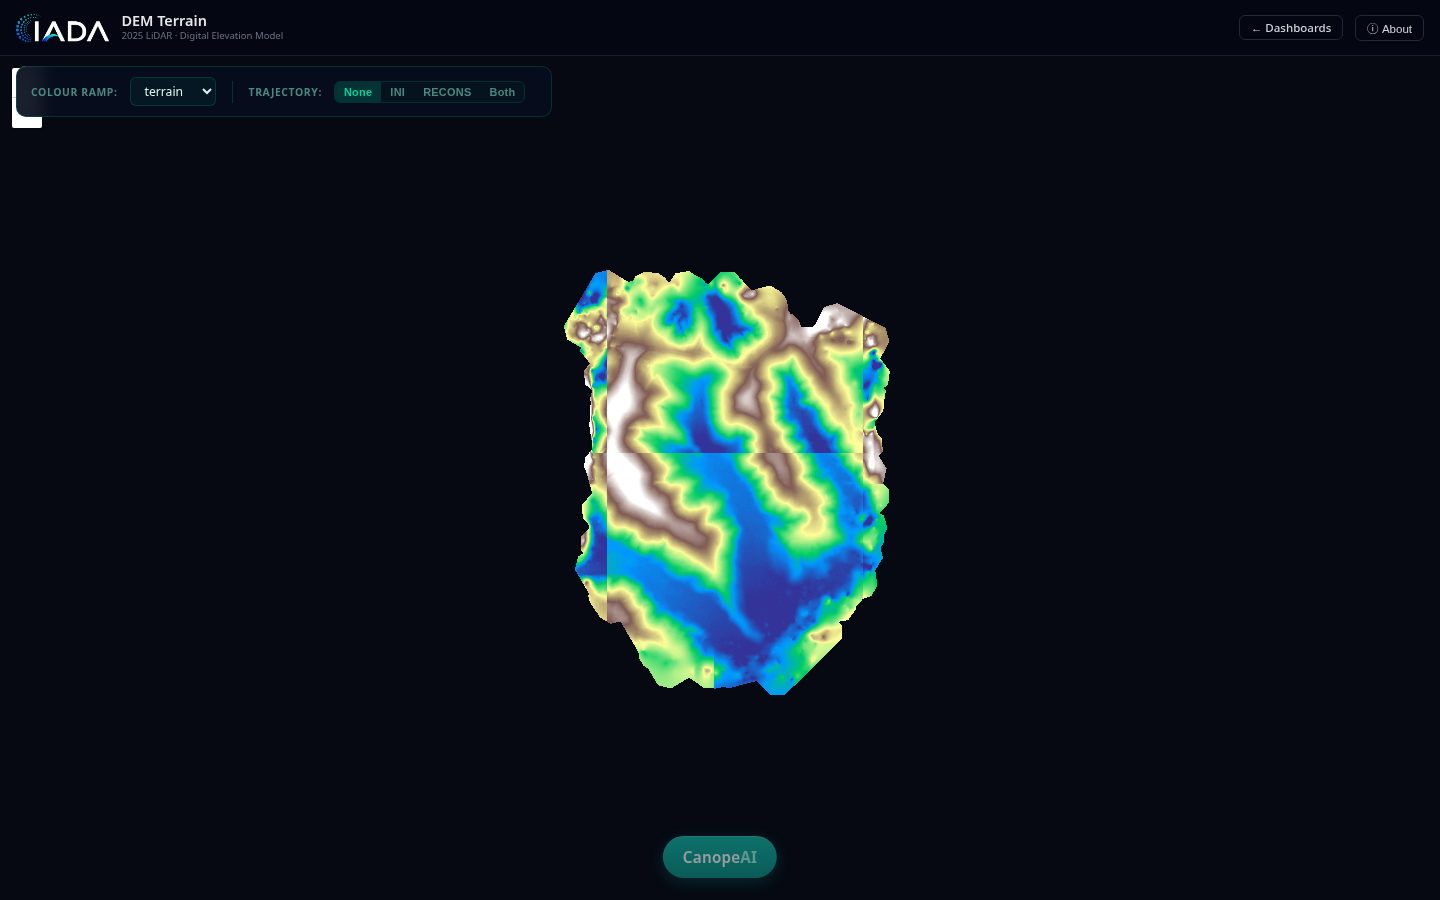
IADA DEM Terrain dashboard rendering the 2025 LiDAR digital elevation model in a terrain colour ramp, with selectable ramp and trajectory overlay controls.
The CanopeAI assistant
CanopeAI is a data-aware AI assistant available on every dashboard. Rather than answering from generic knowledge, it runs queries against the underlying data and replies in plain language, so you can ask about what a view is showing and get an answer grounded in the actual measurements.
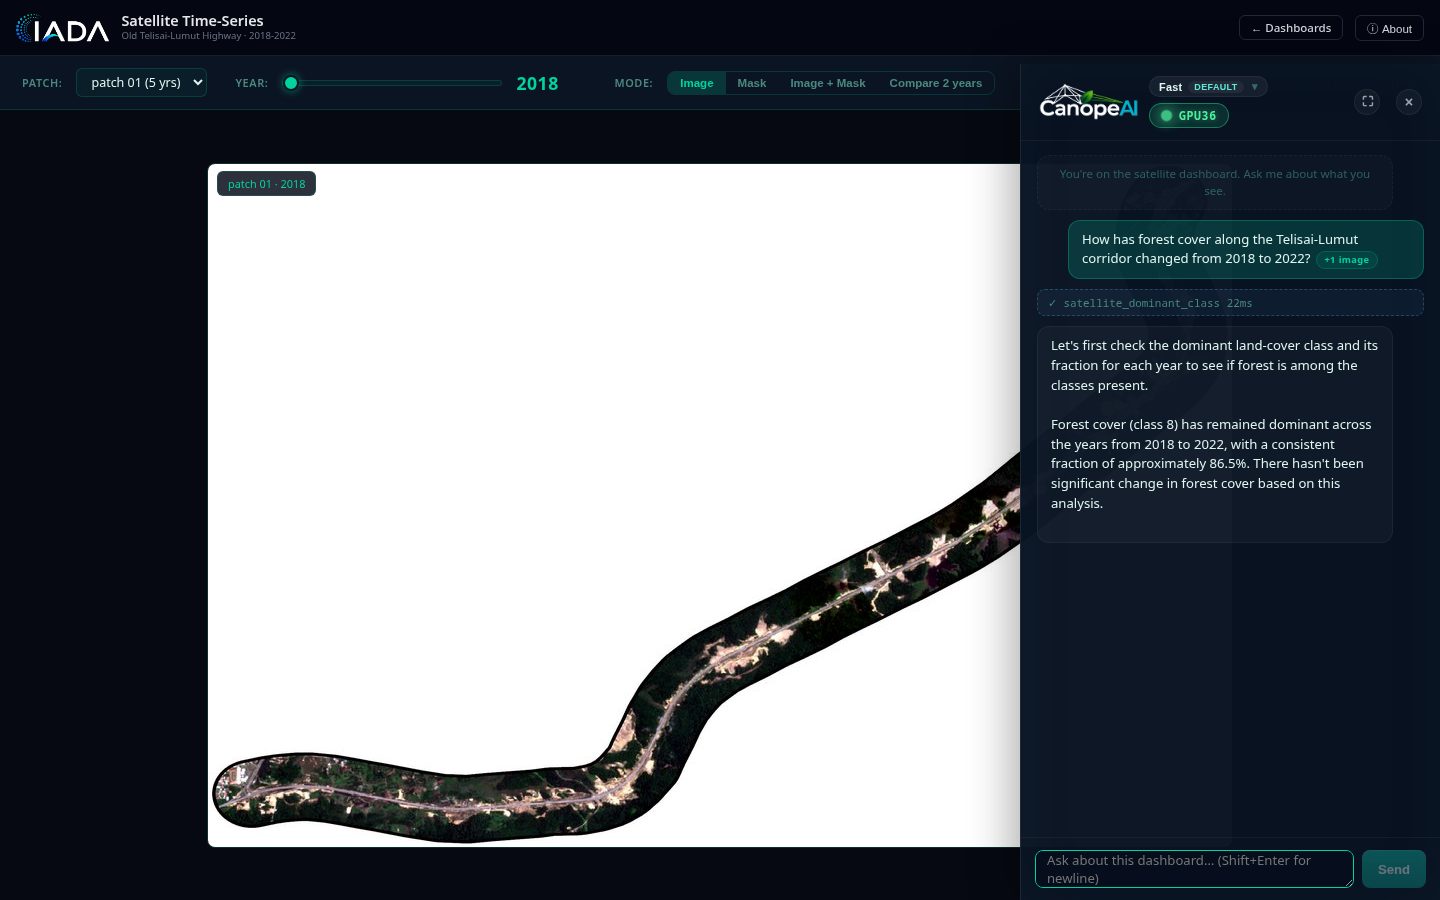
CanopeAI, the GPU-backed assistant docked on the satellite time-series dashboard, queries the data and reports forest cover staying dominant at about 86.5% from 2018 to 2022.
Because the same assistant follows you across the LiDAR, drone, satellite, and terrain views, you can explore the forest by asking questions, with the heavy lifting handled behind the scenes.
Technology
The whole platform is self-hosted by IADA and runs entirely in the browser, with no specialist GIS software required. Potree handles the LiDAR point clouds, Cesium drives the 3D-tiles globe, tiled imagery serves the drone and satellite layers, and CanopeAI ties it together as a data-aware assistant on every view.
Project collaborators
School of Digital Science
-
Dr. Daphne Teck Ching Lai
-
Dr Owais Ahmed Malik
Institute of Applied Data Analytics (IADA)
-
Dr Murtadha Arif Bin Sahbudin
Students
-
Mr Usama Manzoor